Java Virtual Threads in Production: How We Replaced 200-Thread Pools with One Line of Config
A hands-on account of migrating Spring Boot microservices from platform threads to Java 21 virtual threads — what broke, what improved, and the patterns we settled on after three months in production.
Somewhere in our internal wiki there's a Confluence page titled "Thread Pool Sizing Guidelines — Q2 2024." It links to a spreadsheet. The spreadsheet links to a Grafana dashboard. The dashboard has twelve panels, one per microservice, each showing a different maxThreads value that someone tuned by hand after a production incident. I wrote four of those panels. My colleague Ravi wrote three. Nobody remembers who wrote the rest. The page was last updated fourteen months before we deleted it, because Java 21 virtual threads made the entire document pointless.
This post covers the migration I led across our Spring Boot services — the ones handling real traffic at scale. Not the theory, not the JEP summary. The scars, the wins, and the specific code patterns we ripped out or rewrote.
The Actual Problem We Were Solving
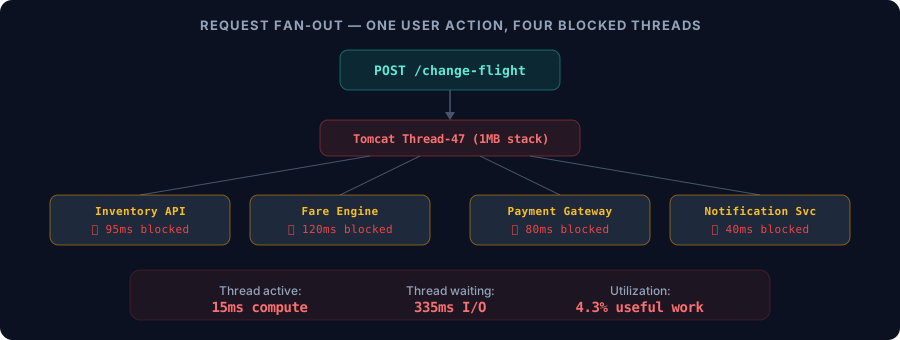
Our booking modification service is a good example. A passenger wants to change a flight. That request triggers calls to an airline inventory system (average 95ms), a fare engine (average 120ms), a payment gateway for hold verification (average 80ms), and a notification service (average 40ms). The Tomcat thread holding that request does nothing useful for 335ms out of every 350ms cycle. It just sits there, allocated, consuming a megabyte of stack memory, waiting for network bytes.
At a thousand concurrent passengers, that's a thousand threads burning a gigabyte of RAM on wait states. The CPU utilization graph shows 11%. The memory graph shows 87%. The Kubernetes HPA sees memory pressure and scales to four pods. The cloud bill for this one service is now four times what the compute actually requires.
Every quarter, we'd revisit the thread pool numbers. Every quarter, traffic patterns had shifted enough to make last quarter's numbers wrong. The booking service needed 350 threads during flash sales but wasted memory keeping them warm during off-peak. The fare aggregator needed 200 during weekday mornings and 80 at night. The payment reconciler ran batch jobs that wanted 50 long-lived threads, not 200 short-lived ones.
@Bean
public WebServerFactoryCustomizer<TomcatServletWebServerFactory> threadPoolTuning() {
    return factory -> factory.addConnectorCustomizers(connector -> {
        var handler = (AbstractProtocol<?>) connector.getProtocolHandler();
        handler.setMaxThreads(350);     // bumped from 200 after the March flash sale meltdown
        handler.setMinSpareThreads(50); // Ravi set this, nobody questions Ravi's numbers
        handler.setConnectionTimeout(8000);
    });
}
We had eleven variations of this bean across the codebase. Each one had a comment explaining the history behind its numbers, like geological strata recording past outages.
One Property, Zero Thread Pool Beans
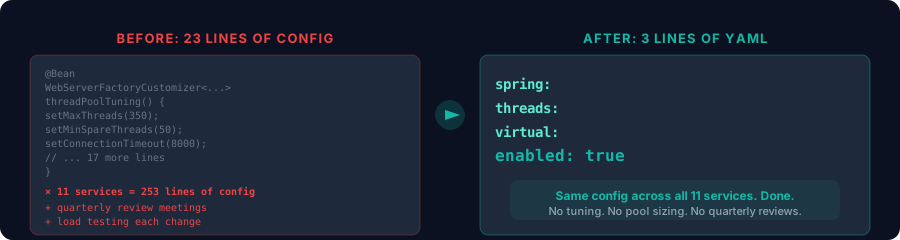
Spring Boot 3.2 added virtual thread support behind a single flag:
spring:
  threads:
    virtual:
      enabled: true
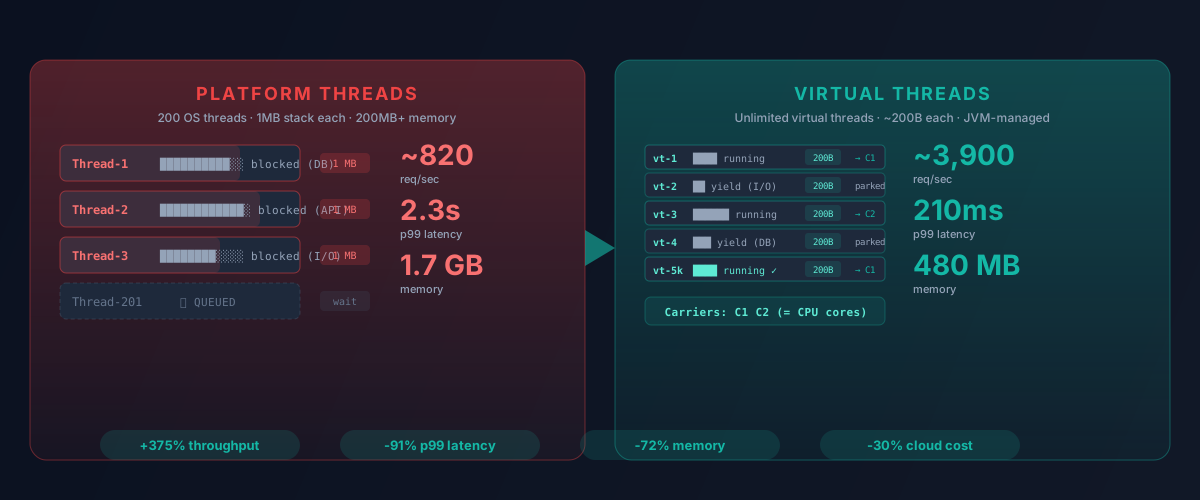
That tells Tomcat to create a virtual thread per request instead of pulling from the platform thread pool. Virtual threads are JVM-managed, not OS-managed. Their stacks start around 200 bytes and grow on demand instead of reserving a megabyte upfront. When a virtual thread blocks on I/O, the JVM unmounts it from its carrier thread (a real OS thread from a small internal ForkJoinPool, typically sized to your CPU core count) and mounts a different virtual thread. The carrier never idles. The virtual thread never wastes memory while waiting.
The shift in mental model is more important than the config change. Platform threads force you to think about capacity: "how many concurrent requests can this pool handle?" Virtual threads eliminate the question. There's no pool to size. The JVM creates as many virtual threads as you need — ten, ten thousand, a hundred thousand — each one weighing kilobytes instead of megabytes. The concurrency bottleneck moves from your application to your downstream dependencies: the database connection pool, the HTTP client connection limit, the actual CPU capacity for compute work.
Staging Numbers That Made the Decision
We canary-tested on the fare aggregation service first. Low blast radius — if it degraded, passengers would see slightly stale pricing for a few seconds, not lose a booking. We ran identical traffic through both configs for a full week and collected these numbers:
| Metric | Platform Threads (200 pool) | Virtual Threads | Delta |
|---|---|---|---|
| Requests/sec at 1K concurrent users | ~820 | ~3,900 | +375% |
| p99 latency at 1K concurrent | 2.3 seconds | 210ms | -91% |
| Heap + thread stack memory | ~1.7 GB | ~480 MB | -72% |
| Requests/sec at 5K concurrent users | ~500 (severe queuing) | ~3,700 | +640% |
| p99 latency at 5K concurrent | Timeouts, 30% error rate | 290ms | Complete recovery |
The 5K test is the one that got leadership's attention. Under platform threads, the service collapsed — pool saturated, requests piled up in the accept queue, timeouts triggered circuit breakers across three upstream callers. Under virtual threads, the service absorbed the load with a 80ms bump in tail latency. No queuing. No errors. Same hardware.
The memory delta alone paid for the migration effort. A service previously running four pods at 2GB (to accommodate thread stack overhead at peak) now ran two pods at 1GB. That arithmetic held across most of our services.
The Parts That Caught Fire
The config change was the easy part. The fires came from assumptions baked into code that was never designed for unbounded concurrency.
Synchronized Blocks and Carrier Pinning
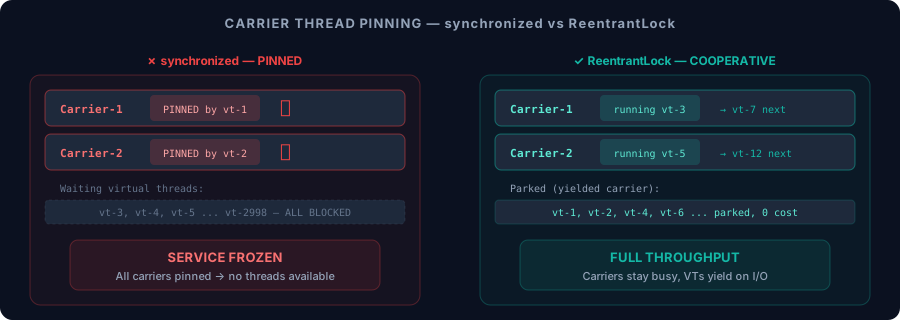
A synchronized block in Java acquires a monitor lock. When a virtual thread holds a monitor and then performs a blocking operation inside it, the JVM cannot unmount that virtual thread from its carrier. It's pinned. The carrier thread — one of maybe eight in the ForkJoinPool on our 8-core instances — is now stuck doing nothing until the synchronized block exits.
We had a custom rate limiter that used synchronized for counter updates. Under platform threads, it never caused issues because the 200-thread pool meant at most 200 threads contending on the lock. Under virtual threads, three thousand requests hit it simultaneously. Eight carrier threads, all pinned. The service froze.
// Worked for three years. Broke in forty minutes under virtual threads.
public class TokenBucketLimiter {
    private int tokens;
    private long lastRefill;

    public synchronized boolean consume() {
        refillIfNeeded();
        if (tokens > 0) {
            tokens--;
            return true;
        }
        parkUntilRefill(); // blocks while holding the monitor — pins the carrier
        return consume();
    }
}
The fix is mechanical — replace synchronized with ReentrantLock. The JVM cooperates with ReentrantLock: when a virtual thread blocks inside a lock() region, it unmounts cleanly from the carrier.
public class TokenBucketLimiter {
    private int tokens;
    private long lastRefill;
    private final ReentrantLock lock = new ReentrantLock();

    public boolean consume() {
        lock.lock();
        try {
            refillIfNeeded();
            if (tokens > 0) {
                tokens--;
                return true;
            }
            parkUntilRefill(); // virtual thread yields the carrier properly
            return consume();
        } finally {
            lock.unlock();
        }
    }
}
Hunting these down is straightforward: run with -Djdk.tracePinnedThreads=short and the JVM prints a stack trace every time pinning occurs. We ran every service in staging with this flag for five days and cataloged every hit. Our code — fixable. A JDBC wrapper in an older driver version — fixed by upgrading. A payment gateway SDK — unfixable, vendor notified, service stays on platform threads until they ship a patch.
Connection Pool Starvation
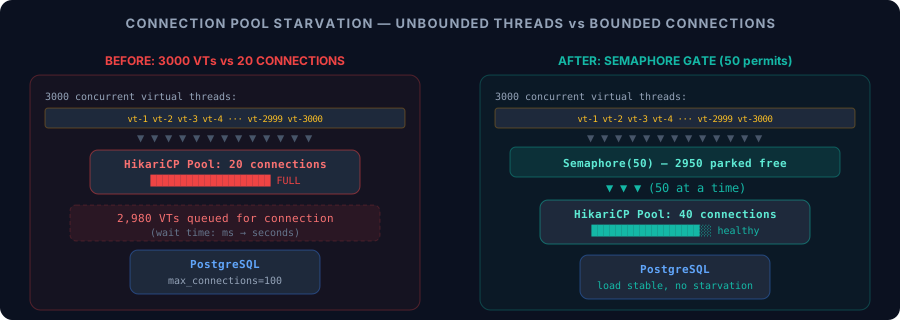
Platform threads imposed an implicit concurrency limit. Two hundred threads meant at most two hundred database queries in flight. Our HikariCP pool of 20 connections handled that comfortably — at worst, 180 threads would briefly wait for a free connection.
Virtual threads removed the ceiling. Three thousand concurrent requests each trying to acquire a database connection meant 2,980 virtual threads queued behind a 20-connection pool. They queue efficiently — virtual threads yield the carrier while waiting — but the database itself only has so much capacity, and the connection wait metrics went from single-digit milliseconds to seconds.
spring:
  datasource:
    hikari:
      maximum-pool-size: 40    # sized to what PostgreSQL can handle, not to thread count
      connection-timeout: 3000 # fail fast rather than queueing for ten seconds
      minimum-idle: 15
For one service with extreme burst characteristics — the price-slash notification writer that spikes to 5x normal load when a sale starts — we added a concurrency throttle using a Semaphore:
private final Semaphore dbGate = new Semaphore(50);

public PriceAlert processSlashEvent(SlashEvent event) {
    dbGate.acquire();
    try {
        return alertRepository.createAndNotify(event);
    } finally {
        dbGate.release();
    }
}
The Semaphore caps concurrent database access at 50 regardless of how many virtual threads exist. Virtual threads waiting on acquire() yield their carrier cleanly, so no resources are wasted.
ThreadLocal Initialization That Used to Be Free
Platform threads are pooled. A ThreadLocal initialized on thread creation pays that cost once and amortizes it across thousands of request cycles. Virtual threads are created per-request and discarded. Every initialization runs every time.
We found a ThreadLocal<SSLContext> in an internal HTTP client wrapper. Building the SSL context loaded two keystores and constructed trust managers — roughly 18ms. On platform threads with a pool of 200, that 18ms happened 200 times at startup and never again. On virtual threads, it happened on every single request.
// 18ms once per platform thread (invisible). 18ms per request on virtual threads (visible).
private static final ThreadLocal<SSLContext> TLS_CTX = ThreadLocal.withInitial(() -> {
    return buildSSLContext(); // loads keystores, builds TrustManagerFactory
});

// Fixed: shared immutable instance, built once at class load
private static final SSLContext SHARED_TLS_CTX = buildSSLContext();
We audited every ThreadLocal in the codebase — grep -rn 'ThreadLocal' --include="*.java" — and found six that had expensive initialization. Four were fixable by hoisting to a static field. Two required scoped restructuring where the per-thread state was genuinely needed (request-scoped MDC context), and for those we verified the initialization cost was trivial.
Rollout Sequence
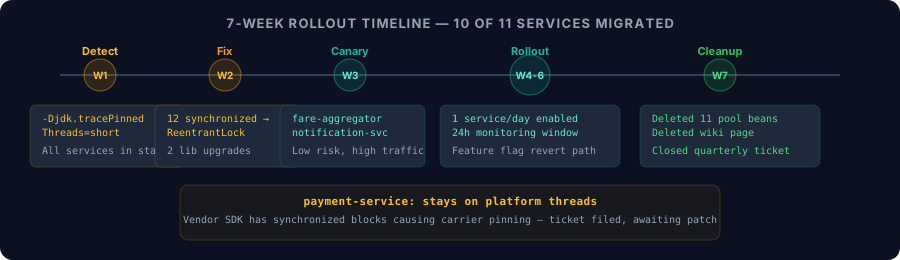
Week 1. Every service running in staging with -Djdk.tracePinnedThreads=short. We piped the logs through a grep script that counted unique pinning stack traces per service. Output: a spreadsheet with service name, pinning count, and whether each pin was in our code or a dependency.
Week 2. Fixing. Twelve synchronized → ReentrantLock conversions in our code. Two library upgrades (HikariCP and a Kafka client wrapper). One vendor ticket filed for the payment SDK.
Week 3. Canary deployment on fare aggregation and notification dispatch. Both low-risk, high-traffic. Monitoring: p50/p95/p99 latency, error rate, HikariCP connection wait time, JVM heap and metaspace, pod memory usage.
Weeks 4–6. One service per day. Enable, monitor 24 hours, move on. The thread pool config stayed in the codebase behind a feature flag: spring.threads.virtual.enabled=${VIRTUAL_THREADS_ENABLED:false}. Revert was a config change in our deployment manifest, not a code rollback.
Week 7. Deleted eleven WebServerFactoryCustomizer beans. Deleted the thread pool tuning wiki page. Closed the recurring "Q-review thread pool sizes" ticket. Updated the on-call runbook to remove thread pool exhaustion as a troubleshooting category.
Ten of eleven services migrated. The payment service stays on platform threads until its SDK vendor addresses the pinning.
What It Looks Like Now
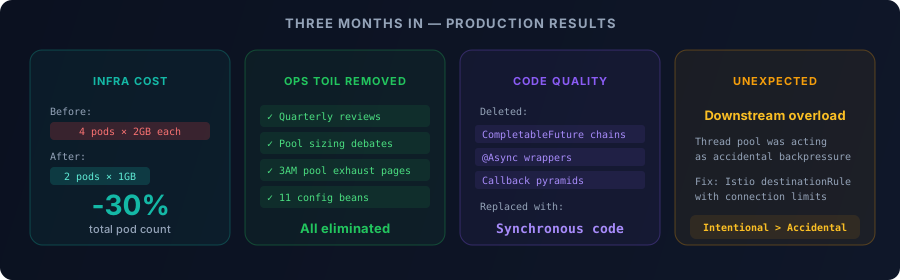
Three months in:
Infrastructure cost dropped measurably. Fewer pods needed per service. Total pod count across the affected services fell by roughly 30%. Two services that previously needed vertical scaling (4GB pods to accommodate thread stacks at peak) now run on 2GB pods.
The thread pool tuning practice is gone. No more quarterly reviews. No more arguments about 200 vs. 350. No more 3 AM pages because pool exhaustion cascaded during a traffic spike. The JVM manages concurrency, and it manages it better than our spreadsheets did.
Synchronous code came back. Three services had CompletableFuture chains and @Async wrappers that existed solely to avoid blocking the thread pool. We deleted them. The code now reads top-to-bottom: call the service, get the result, call the next service. Blocking is cheap when threads are cheap.
One surprise: downstream overload. The thread pool was accidentally acting as a backpressure mechanism. Remove it, and downstream services see traffic spikes they've never seen before. We added explicit rate limiting at the service mesh layer (Istio destinationRule with connection limits). Intentional throttling replacing accidental throttling — better engineering, but something we didn't anticipate during planning.
What I'd Tell You If You Asked Me at a Conference
If your Spring Boot services spend most of their time waiting on network calls and database queries — and that's most Spring Boot services — virtual threads are worth a sprint of effort. The migration is mechanical, the gotchas are well-documented (pinning, connection pools, ThreadLocal), and the payoff is immediate in both latency and cost.
If your service does heavy computation — ML inference, image rendering, financial risk modeling — virtual threads won't hurt, but they won't help. The bottleneck is CPU cores, not thread count. Keep your platform threads sized to your core count.
If you're already running WebFlux with Reactor, don't switch. Reactive code doesn't block, so the problem virtual threads solve doesn't apply. We kept our real-time event pipeline on WebFlux for exactly this reason.
For everything else: enable the flag, hunt the pins, resize the connection pools, audit the ThreadLocals, and delete the thread pool tuning wiki page. It's one of the more satisfying weeks of infrastructure work I've had in nine years of building these systems.
Specific questions about the migration, or hitting an edge case I haven't covered? I've been through most of the sharp edges — drop me a note.
Related Articles
- Building Microservices at 130 Million Requests Per Day — the architecture where these thread pool problems lived
- AI-Driven Development: Running Autonomous Agents Across a Microservices Codebase — another way to cut operational toil at scale
- OpenBanking PSD2 API Development — high-throughput Java patterns in fintech