How a Single Trace Ended a 3-Day Debugging Nightmare Across 8 Microservices
A production war story about implementing OpenTelemetry distributed tracing in Spring Boot — from blind log-grepping to finding the root cause of a daily latency spike in twenty minutes.
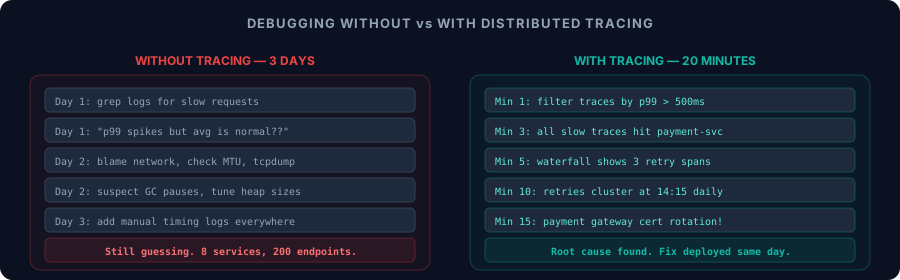
Every Tuesday and Thursday at 2:15 PM, our booking retrieval API crossed a one-second p99 latency threshold. PagerDuty fired. Somebody acknowledged. The spike lasted four to six minutes, then vanished. Metrics returned to normal. The on-call engineer wrote "transient network issue" in the incident report and moved on.
This went on for three weeks before I inherited the on-call rotation and decided that "transient" wasn't an explanation — it was a confession that we didn't know what was happening.
We had logs. We had Prometheus metrics. We had Grafana dashboards with thirty-two panels per service. None of them could answer the question I actually needed answered: which specific downstream call, in which specific service, is turning a 100ms request into a 980ms request, and why does it happen on a schedule?
That question is the reason distributed tracing exists. This is the story of implementing OpenTelemetry across our Spring Boot services, finding the root cause in the first twenty minutes of having trace data, and the operational patterns we've settled on six months later. All of this runs against the production systems in my portfolio.
What Logs and Metrics Couldn't Tell Us
Logs are service-local. Our booking service logged Request BK-4419287 completed in 980ms, but it didn't say which of its four downstream calls was slow. Adding timing logs to each call site would have helped — for that service. But the slow call might itself be calling three other services. The problem can be anywhere in a chain eight services deep, and manually correlating timestamps across eight log streams by eyeballing request IDs is exactly as miserable as it sounds.
Metrics are aggregated. Prometheus told us p99 latency spiked. It told us the payment service's error rate ticked up at the same time. Correlation, not causation. Was the payment service the cause, or was it also a victim? Were the retries coming from the booking service or the API gateway? How many retries per request? Metrics don't answer per-request questions.
What I needed was a way to follow a single request as it moved through all eight services — see exactly which call took how long, which calls were retries, and what the timing relationship was between them. A trace.
OpenTelemetry in Five Minutes, Not Five Sprints
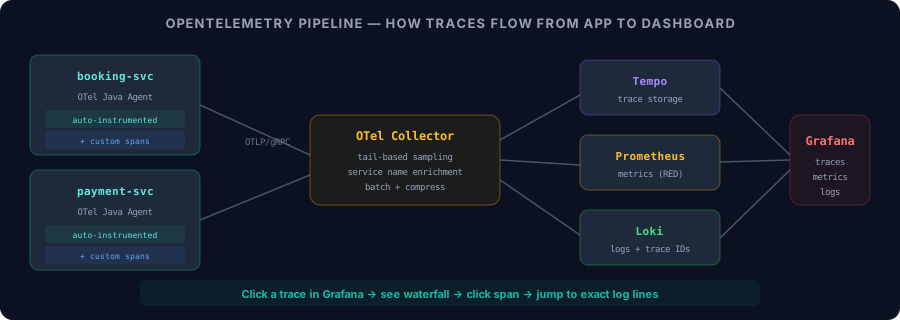
The implementation took a day. Not because we cut corners — because the OpenTelemetry Java agent does the hard work automatically.
The agent attaches to the JVM at startup and instruments HTTP clients, JDBC drivers, Kafka producers/consumers, gRPC stubs, and the Spring MVC dispatcher without any code changes. It creates spans for each operation, propagates trace context through HTTP headers (traceparent, the W3C standard), and exports everything via OTLP to a collector.
Our deployment added three things:
1. The Java agent JAR in the Docker image:
ADD https://github.com/open-telemetry/opentelemetry-java-instrumentation/releases/latest/download/opentelemetry-javaagent.jar /opt/otel/agent.jar

ENV JAVA_TOOL_OPTIONS="-javaagent:/opt/otel/agent.jar"
ENV OTEL_SERVICE_NAME="booking-svc"
ENV OTEL_EXPORTER_OTLP_ENDPOINT="http://otel-collector.monitoring:4317"
ENV OTEL_TRACES_SAMPLER="parentbased_always_on"
Four environment variables. The agent picks them up at startup. Every HTTP request handled by Spring MVC automatically generates a trace. Every outgoing call via RestTemplate, WebClient, or HttpClient automatically creates a child span with the correct parent context.
2. An OpenTelemetry Collector deployment:
The collector sits between the applications and the storage backends. It receives spans from all services, processes them (enrichment, sampling, batching), and exports to Tempo (traces), Prometheus (span metrics), and Loki (correlated logs).
receivers:
  otlp:
    protocols:
      grpc:
        endpoint: 0.0.0.0:4317

processors:
  batch:
    timeout: 5s
    send_batch_size: 1024
  resource:
    attributes:
      - key: deployment.environment
        value: production
        action: upsert

exporters:
  otlp/tempo:
    endpoint: tempo.monitoring:4317
    tls:
      insecure: true
  prometheus:
    endpoint: 0.0.0.0:8889

service:
  pipelines:
    traces:
      receivers: [otlp]
      processors: [batch, resource]
      exporters: [otlp/tempo]
    metrics:
      receivers: [otlp]
      processors: [batch]
      exporters: [prometheus]
3. Grafana data sources pointing at Tempo and Prometheus.
That was the infrastructure. By 4 PM on a Wednesday, every service was emitting traces. By 4:30, I had the Grafana Tempo explore view open, watching live requests flow through the system. By 4:45, I found the bug.
The Trace That Solved Three Weeks of Incidents
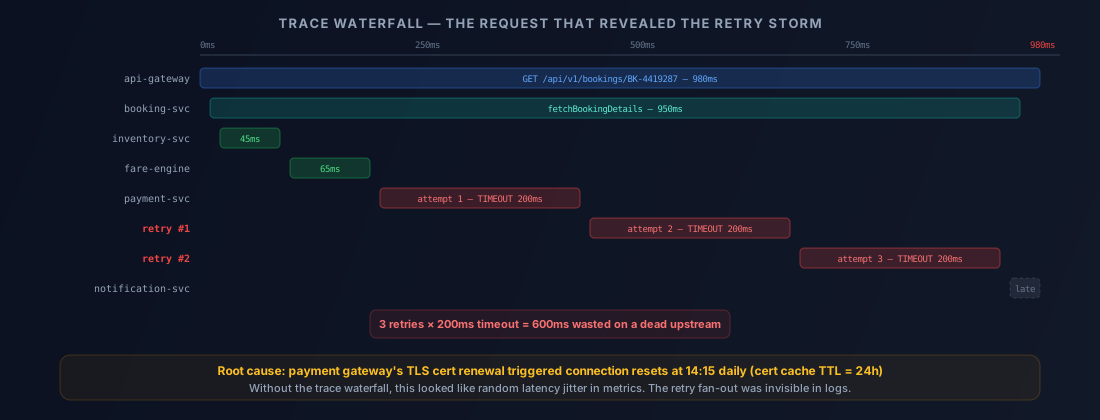
I filtered traces by duration > 500ms and opened the first one. The waterfall view showed the complete request lifecycle:
The API gateway span covered the full 980ms. Inside it, the booking service span at 950ms. Inside that: inventory service at 45ms (fast), fare engine at 65ms (fast), and then three consecutive spans hitting the payment service — each one timing out at 200ms.
Three retries. Six hundred milliseconds of wasted time, stacked sequentially because our retry policy was configured without backoff.
But that was the symptom, not the cause. The payment service wasn't slow — it was refusing connections. Each span had an error attribute: Connection reset by peer. The payment service's own traces showed it was healthy, responding to other callers in 30ms. Only the booking service's calls were failing, and only at 2:15 PM.
I expanded the span attributes on the first failed attempt. The OpenTelemetry agent had captured the connection details: net.peer.name=pay-gateway.internal, net.peer.port=443. TLS connection. I checked the payment gateway's certificate rotation schedule. Their operations team had configured automatic cert renewal — every 24 hours, at 2:15 PM UTC. When the cert renewed, existing TLS sessions were invalidated. Our HTTP client's connection pool held stale connections that the gateway reset.
The fix: configure the HttpClient connection pool to set a maximum connection lifetime shorter than the cert rotation interval.
@Bean
public HttpClient paymentHttpClient() {
    ConnectionProvider provider = ConnectionProvider.builder("payment")
        .maxConnections(50)
        .maxIdleTime(Duration.ofMinutes(5))
        .maxLifeTime(Duration.ofMinutes(20))
        .evictInBackground(Duration.ofMinutes(2))
        .build();
    return HttpClient.create(provider);
}
Twenty-minute maximum connection lifetime. Background eviction every two minutes. The stale connections get recycled well before the cert rotation hits. The retry storm disappears. A fix that took longer to type than to find, because the trace waterfall pointed directly at the exact call, the exact error, and the exact timing pattern.
Custom Spans for Business Logic
Auto-instrumentation covers the plumbing — HTTP calls, database queries, message queue operations. But some of the most valuable debugging data lives in your application logic, and the agent can't instrument what it can't see.
We add custom spans around business-critical operations where we need visibility into internal timing:
@Service
public class FareCalculationService {

    private final Tracer tracer;

    public FareCalculationService(OpenTelemetry openTelemetry) {
        this.tracer = openTelemetry.getTracer("fare-engine");
    }

    public FareResult calculate(BookingRequest request) {
        Span span = tracer.spanBuilder("fare.calculate")
            .setAttribute("booking.route", request.getRoute())
            .setAttribute("booking.pax_count", request.getPassengerCount())
            .setAttribute("booking.cabin_class", request.getCabinClass())
            .startSpan();

        try (Scope scope = span.makeCurrent()) {
            FareResult result = doCalculation(request);
            span.setAttribute("fare.total_minor", result.getTotalMinor());
            span.setAttribute("fare.currency", result.getCurrency());
            return result;
        } catch (Exception e) {
            span.setStatus(StatusCode.ERROR, e.getMessage());
            span.recordException(e);
            throw e;
        } finally {
            span.end();
        }
    }
}
The booking.route, booking.pax_count, and fare.total_minor attributes are searchable in Tempo. When a customer reports a fare discrepancy, we search for booking.route = "BOM-DEL" and fare.total_minor > 1500000 and pull up the exact trace that served their request — complete with timing for every downstream call, database query, and cache lookup.
We settled on a convention: business attributes use a dot-separated namespace matching the service domain (booking.*, fare.*, payment.*). Technical attributes use the OpenTelemetry semantic conventions (http.method, db.statement, rpc.service). The namespace separation keeps the trace search UI manageable.
Tail-Based Sampling: Keep What Matters, Drop What Doesn't
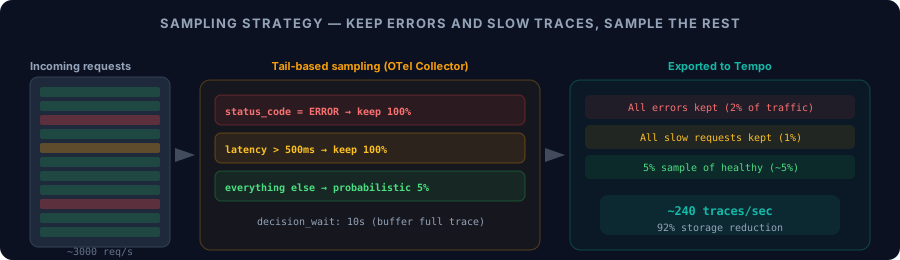
At 3,000 requests per second across eight services, collecting every trace generates roughly 50GB of data per day. Our Tempo cluster would need to scale weekly, and most of those traces are identical healthy requests that nobody will ever look at.
Head-based sampling (decide at the start of a trace whether to keep it) solves the volume problem but creates a worse one: if you sample 5% of traces, you have a 5% chance of capturing any given error. The exact traces you need for debugging are the ones most likely to be discarded.
Tail-based sampling solves this. The collector buffers complete traces for a short window (we use 10 seconds), examines the full trace — including whether any span has an error or whether the total duration exceeds a threshold — and then decides whether to keep or drop it.
Our sampling policy in the collector:
processors:
  tail_sampling:
    decision_wait: 10s
    num_traces: 100000
    policies:
      - name: errors-always
        type: status_code
        status_code:
          status_codes: [ERROR]
      - name: slow-always
        type: latency
        latency:
          threshold_ms: 500
      - name: baseline-sample
        type: probabilistic
        probabilistic:
          sampling_percentage: 5
Every error trace is kept. Every trace slower than 500ms is kept. Everything else is sampled at 5%. The result: we store roughly 240 traces per second instead of 3,000. Storage dropped 92%. Every trace we actually need for debugging is guaranteed to be there.
The 10-second decision_wait is a tradeoff. The collector buffers spans in memory until the trace is complete (all spans have arrived or the window expires). At 100,000 concurrent traces, that's roughly 2GB of memory. We run the collector with 4GB heap and haven't hit pressure. If your request rate is higher, you can reduce the window or increase the memory allocation.
Correlating Traces with Logs
The most underrated feature of OpenTelemetry: trace context in log lines. The Java agent automatically injects trace_id and span_id into the MDC (Mapped Diagnostic Context), which means every log line emitted during a traced request carries the trace identifier.
Our Logback pattern:
<pattern>%d{HH:mm:ss.SSS} [%thread] %-5level %logger{36} trace=%X{trace_id} span=%X{span_id} - %msg%n</pattern>
A log line looks like:
14:15:03.221 [virtual-47] ERROR c.k.payment.PaymentGatewayClient trace=abc123def456 span=789ghi - Connection reset by peer
In Grafana, clicking a span in the trace waterfall jumps to the exact log lines for that span. No more correlating timestamps by hand. No more guessing which log entry belongs to which request. The trace ID is the join key between traces and logs, and it's injected automatically.
This alone justified the implementation. Before tracing, debugging a production issue meant opening eight terminal tabs, running grep with approximate timestamps, and hoping the clocks were synchronized closely enough. Now: find the trace, click the span, read the logs. The path from "something is wrong" to "here is the exact error message" takes seconds.
Six Months of Operational Patterns
Pattern 1: Trace-driven alerting. Our PagerDuty alerts now trigger on trace-derived metrics, not just Prometheus counters. "Error rate above 1%" is useful. "Error rate above 1% and 80% of error traces show timeout on payment-svc downstream call" is actionable. We export span metrics from the collector to Prometheus and alert on the combination.
Pattern 2: Deployment validation. After every deploy, we compare trace latency distributions between the new version and the previous one. A p99 regression of more than 20% on any span blocks the progressive rollout. This has caught two regressions that metrics-level alerting missed — both were in custom spans around internal logic that didn't surface in HTTP-level percentiles.
Pattern 3: Dependency mapping. The trace data generates a live service dependency graph. We know which services call which, at what frequency, and with what latency characteristics. When we planned the virtual threads migration (covered in a separate post), this graph told us which services had the most blocking I/O calls and would benefit most from the switch.
Pattern 4: SLA tracking per customer. Enterprise customers get their own trace attributes (customer.tier = "enterprise"). We can pull up every trace for a specific customer, see their actual latency experience, and proactively reach out when their p99 degrades — before they file a ticket.
What I'd Set Up on Day One
If you're running Spring Boot microservices without distributed tracing, here's the priority order:
Week 1: Deploy the OpenTelemetry Java agent on every service. Zero code changes. The auto-instrumentation covers HTTP, JDBC, Kafka, gRPC, and Redis out of the box. Export to a single Tempo instance. This alone gives you trace waterfalls.
Week 2: Set up the OpenTelemetry Collector with tail-based sampling. Without it, storage costs will become a problem within a month at any meaningful traffic volume. Keep all errors, keep all slow traces, sample the rest.
Week 3: Add trace-log correlation. Configure Logback/Log4j to include trace IDs. Set up Grafana to link between Tempo and Loki. This is the workflow multiplier — it turns trace investigation from "useful" to "indispensable."
Week 4 and beyond: Add custom spans around business logic. Instrument the operations that matter to your domain. Build trace-derived alerts. Integrate with your deployment pipeline for regression detection.
The total effort is one engineer-week for the infrastructure and another week for custom instrumentation. The return is the difference between spending three days guessing at the cause of a latency spike and spending twenty minutes reading a trace waterfall that points at the exact line, the exact call, and the exact moment it went wrong.
The Tuesday/Thursday incident? Gone. The "transient network issue" excuse? Retired alongside the database migration runbook. What replaced them is a trace search box and the confidence that comes from actually seeing what your distributed system does.
Related Articles
- Java Virtual Threads in Production — the migration that trace data helped us plan
- Zero-Downtime Database Migrations with Flyway — another production pattern from the same stack
- Building Microservices at 130 Million Requests Per Day — the architecture these traces run against