OpenTelemetry Java Agent 3.0 Migration: Kafka Dashboards
OpenTelemetry Java agent 3.0 renames Kafka spans, so dashboards and alerts go blank. Migrate Spring Boot 4 safely with dual-emit and Collector remaps.

Short answer: upgrading to the OpenTelemetry Java agent 3.0 can silently break Spring Boot Kafka dashboards and alerts, because Kafka spans move to new verb-style names such as poll orders. To migrate safely, inventory every query that depends on span names, emit old and new telemetry side by side, remap names in the Collector, canary one consumer group and lint alert queries in CI.
The incidents that cost me the most sleep made no noise at all. No crash, no page. One panel on a wall dashboard drew a flat line, and the first person to notice was a customer.
Swapping an observability agent version can produce exactly that. The OpenTelemetry Java agent 3.0 changes several telemetry defaults, including how Kafka work is named. I treat a major agent bump as a production change with its own inventory, canary and diff, the same way a schema migration would be handled, and not as a line in pom.xml.
Start here: what the agent actually does
Some vocabulary, kept short, since the rest of the post leans on it.
OpenTelemetry (OTel) is the CNCF project that standardises how applications emit traces, metrics and logs. A span is one timed unit of work, say a Kafka poll or an HTTP handler. A trace strings together the spans of one request as it crosses services. In Kafka, producers write to a named topic and consumers in a consumer group read from it.
The Java agent is a JAR passed with -javaagent at JVM start. It rewrites library classes as they load, so Spring MVC, Kafka clients and JDBC drivers emit spans with zero source changes. The convenience has a price: you never chose those span names, so you may not know how many dashboards quietly depend on them.
Every span carries a name and attributes (key-value facts such as topic or consumer group). Dashboards, alerts and sampling rules filter on those. Rename one and the filter matches nothing, with no error anywhere.
What changes in 3.0, and why Kafka is the loudest case
The agent follows the OpenTelemetry semantic conventions, the project's naming spec for spans, metrics and attributes. As the conventions evolve, the agent's output follows. In the 3.0 line, Kafka spans move to verb-first names: what used to appear as orders receive or orders process is now poll orders or process orders. Attribute keys move too. The kind of change to expect, based on the messaging conventions, looks like this:
| Old shape (example) | New shape (example) |
|---|---|
span orders receive | span poll orders |
span orders process | span process orders |
messaging.kafka.consumer.group | messaging.consumer.group.name |
messaging.kafka.destination.partition | messaging.destination.partition.id |
Treat that table as an illustration of the pattern, not the authoritative list. I have not verified every row against the 3.0 build you will run, and the exact set depends on your instrumentation versions, so diff real spans (Step 4) and read the release notes before you write anything into a runbook.
Why Kafka hurts most, in practice:
- Event-driven systems are watched through message-path spans, which are the ones renamed. A Grafana Tempo query like
{ name = "orders process" && resource.service.name = "orders-consumer" }simply returns an empty set after the upgrade. - Lag and processing-time alerts are frequently built from span-derived metrics (a spanmetrics connector, for instance), such as
duration_milliseconds_bucket{span_name="orders process"}. The series stops being written under that label, and the alert expression evaluates to nothing. - A consumer has no user waiting on it, so nobody complains when its alert goes blind. The silence can last days.
Kafka share groups will reshape consumer topology again; I covered that in Kafka share groups in Spring Boot payment pipelines. Whatever contract file you build below should survive that change as well.
On an airline platform handling roughly 130 million requests a day, I once watched a latency chart that had not broken at all. A refactor had changed what its query matched, so it was now averaging a smaller, calmer population of spans, and a retry storm sat unnoticed for most of a weekend. In payments work under PSD2 the stakes are sharper. Regulators do not mandate alerting on span names, but if your fraud or settlement alert depended on one and silently stopped, you would struggle to explain your monitoring story afterwards. If the pipeline moves money, treat telemetry names as an interface. The tracing setup underneath is in distributed tracing with OpenTelemetry in Spring Boot; this post covers what happens when the agent changes beneath it.
The failure modes, ordered by how often they bite
After a rename like this, these are the things that break:
- Dashboards filtered by span name. A panel plotting p95 of
orders processdrops to zero or "no data". - Alert rules on span-derived metrics or trace queries. They fail open: most alert engines treat "no data" as healthy unless told otherwise.
- Trace-based SLOs. An SLO of "good spans over total spans" with a name filter returns 100 percent on an empty set, or divides by zero, depending on the tool.
- Tail-sampling policies. A rule that keeps every trace containing an error span with a given name stops matching. Or the catch-all keeps everything and your storage bill climbs.
- Recording rules and exemplars that derive labels from span names.
- Saved searches that the on-call engineer opens at 3 a.m.
The last one gets missed every time, because nobody tracks saved searches in a repo. The same name-dependency applies to AI-service dashboards, which my notes on observability and guardrails for agentic AI backends discuss.
The migration playbook
This is the sequence I would run for a Spring Boot 4 fleet on Kubernetes.
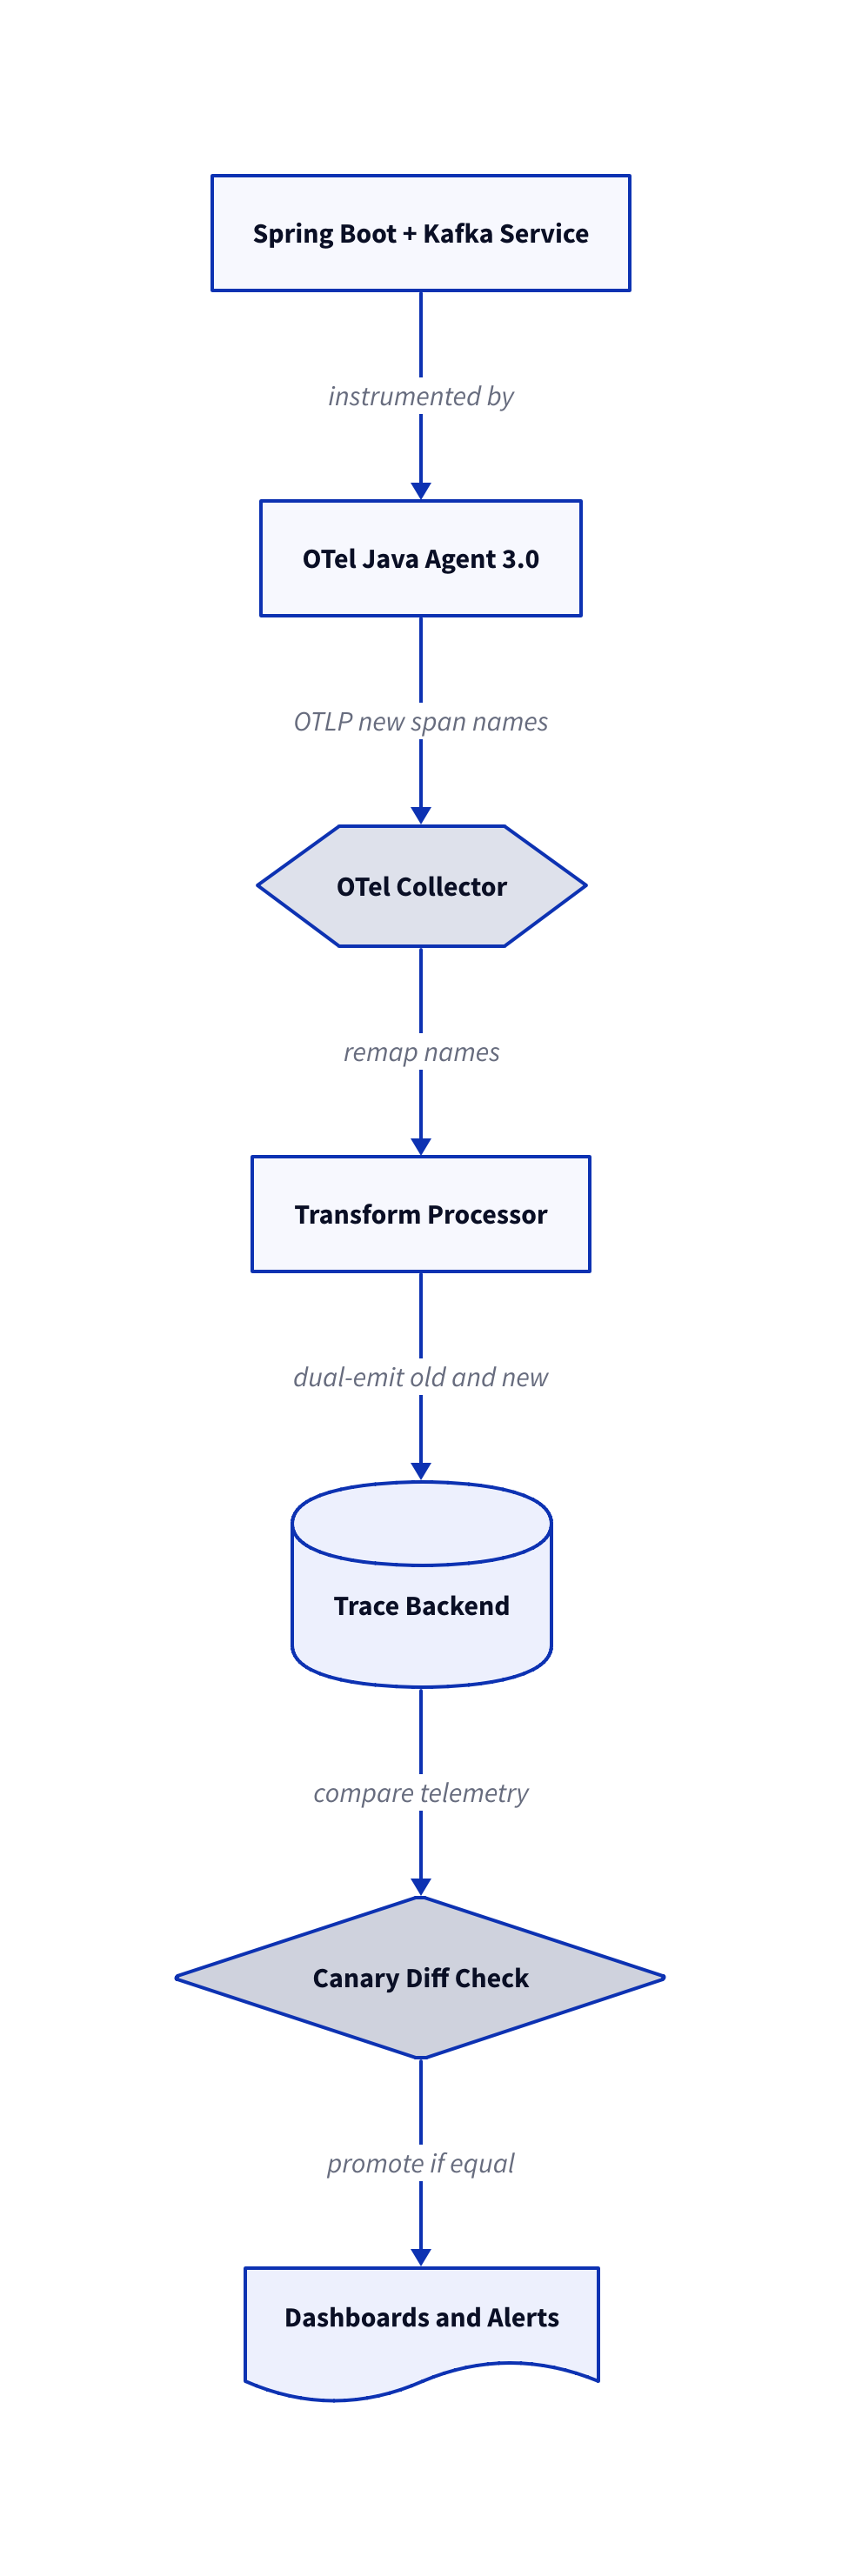
Step 1: Inventory everything that depends on names or attributes
Before changing a version, extract the list from source rather than from memory.
- Export dashboards as JSON and grep for span names, attribute keys and metric names.
- Export alert rules, recording rules and SLO definitions.
- Pull tail-sampling and filter configs from the Collector repo.
- Search application code for hand-written span names and for code that reads attributes (some teams branch on
messaging.destination.name). - Ask on-call engineers for their saved searches.
Per item, note what it matches, who owns it, and what happens when it matches nothing. The last column is the useful one: "pages the on-call" and "feeds a weekly report" deserve very different urgency.
A rough script gets you most of the way:
# Find every dashboard/alert artefact that mentions Kafka-derived span names or attributes
grep -rEn "(\b(receive|process|publish)\b orders|messaging\.(kafka|destination|operation)|kafka\.)" \
  observability/dashboards observability/alerts observability/slo collector/ \
  | sort | tee inventory-kafka-names.txt
wc -l inventory-kafka-names.txt
It is crude, but a crude list you actually have beats a careful plan with no list.
Step 2: Prefer dual-emit or an opt-in flag over a hard cutover
OpenTelemetry has a convention for these transitions: a stability opt-in that keeps the old shape, emits the new one, or emits both for a while. For HTTP and database conventions this is the OTEL_SEMCONV_STABILITY_OPT_IN environment variable, which has a duplicate-emit value. Whether the Kafka and messaging spans in 3.0 sit behind that same switch or an agent-specific property is something to confirm in the release notes for your exact version.
What matters is the goal: old and new telemetry present together, in the same backend, for the same requests. That turns the migration into a comparison.
I set it in the Deployment so the change is reviewable and revertable like any other config:
env:
  - name: JAVA_TOOL_OPTIONS
    value: "-javaagent:/otel/opentelemetry-javaagent.jar"
  - name: OTEL_SERVICE_NAME
    value: "orders-consumer"
  # Confirm the exact opt-in value for messaging in the 3.0 release notes
  - name: OTEL_SEMCONV_STABILITY_OPT_IN
    value: "<dual-emit value from release notes>"
  - name: OTEL_RESOURCE_ATTRIBUTES
    value: "agent.rollout=canary-v3"
The rollout attribute is deliberate. Tagging telemetry with its cohort lets every query and diff split canary from baseline.
If there is no dual mode for a particular rename, the next step covers it.
Step 3: Remap names in the Collector during the transition
The OpenTelemetry Collector is a standalone service that receives telemetry, processes it and forwards it. Its transform processor rewrites span names and attributes with OTTL (OpenTelemetry Transformation Language).
Choose a direction. I remap new to old first, so existing dashboards work on day one, then migrate dashboards at a calm pace and delete the remap last. Going old to new would force every query to change before the upgrade, which is the cutover we are avoiding.
processors:
  transform/kafka_compat:
    error_mode: ignore
    trace_statements:
      - context: span
        statements:
          # "poll orders" -> "orders receive" ; "$$" escapes "$" in Collector config
          - replace_pattern(name, "^poll (.+)$", "$$1 receive") where attributes["agent.rollout"] == "canary-v3"
          # "process orders" -> "orders process"
          - replace_pattern(name, "^process (.+)$", "$$1 process") where attributes["agent.rollout"] == "canary-v3"
          # Keep a breadcrumb so we can query what was remapped
          - set(attributes["compat.remapped"], true) where attributes["agent.rollout"] == "canary-v3"

service:
  pipelines:
    traces:
      receivers: [otlp]
      processors: [memory_limiter, transform/kafka_compat, batch]
      exporters: [otlphttp]
Three lessons from getting burned. Test OTTL against recorded spans before deploying, because error_mode: ignore turns a typo into the same silent failure we are fighting. Add the compat.remapped breadcrumb and graph it, so you can watch it fall to zero as dashboards migrate. And do the remap in the Collector, not in the app, so a rollback needs no application redeploy.
Metrics need care too. If span names feed a span-metrics connector, the remap must run before that connector sees them. Otherwise your derived metrics carry new names while your alerts still ask for the old ones.
Step 4: Canary with diffed span output
Most teams skip this step, and it is the one that pays off.
Run the new agent on a small slice of one consumer group, for example one pod in twelve on a non-critical topic, with the others on the old agent. Kafka partitions are shared across the pods of a group, so canary and baseline process comparable work in the same window. You get a natural experiment for free.
Then compare mechanically:
- Export a few thousand spans per cohort (a Collector
fileexporter or a backend query). - Normalise: drop trace IDs, timestamps and durations.
- Group by (span name, kind, sorted attribute keys) and count.
- Diff the two sets.
import json, collections, sys

def shape(path):
    c = collections.Counter()
    for line in open(path):
        s = json.loads(line)
        key = (s["name"], s["kind"], tuple(sorted(s["attributes"].keys())))
        c[key] += 1
    return c

old, new = shape(sys.argv[1]), shape(sys.argv[2])
for k in sorted(set(old) | set(new)):
    if (k in old) != (k in new):
        side = "ONLY-OLD" if k in old else "ONLY-NEW"
        print(side, k)
Every line of output is either an expected rename from your inventory or a surprise, and the surprises are the point. This is how I would catch renamed attributes, dropped attributes and extra spans that skimming a changelog would never surface.
Compare behaviour as well as shape: error rate, spans per message and consumer lag across cohorts. An agent upgrade can change overhead or how context travels in message headers. If a trace that used to cover producer and consumer now splits into two unrelated traces, find out before 100 percent of traffic is on it. Propagation matters even more through an outbox; see transactional outbox and idempotent consumers.
Let the canary live through a peak, not a quiet afternoon. On the live market-data systems I run, behaviour at the open looks nothing like midday, and an observability change deserves judging under the load you fear. The same reasoning drives my deterministic market-data replay engine on QuestDB.
Step 5: Lint alert queries in CI
Manual diligence decays, so make the pipeline refuse alert rules that reference telemetry nobody emits.
Keep a contract file listing the span names, metric names and attribute keys your rules may use. Generate it from the Step 4 diff or from staging. A CI job then parses every dashboard and alert definition and fails on anything outside the contract.
#!/usr/bin/env bash
# ci/lint-alert-names.sh: fail if any alert references a name outside the telemetry contract
set -euo pipefail
allowed=$(cat observability/telemetry-contract.txt)
status=0
for f in observability/alerts/*.yaml; do
  # pull quoted tokens that look like span or metric names
  for name in $(grep -oE '"[a-z_.]+ [a-z_.-]+"|span_name="[^"]+"' "$f" | tr -d '"' ); do
    if ! grep -qxF "$name" <<<"$allowed"; then
      echo "UNKNOWN TELEMETRY NAME in $f: $name"; status=1
    fi
  done
done
exit $status
A production version should parse PromQL properly instead of grepping, but even this blunt tool catches the common case. Add a synthetic canary alert too: push one message through staging and assert the expected alert condition becomes reachable. That tests the whole chain, not only the strings.
Last, check how each alert treats "no data". Making critical rules fire on absence is a cheap guard against the flat-line failure this post opened with.
A rollout timeline I would use
| Phase | Action | Exit condition |
|---|---|---|
| Week 0 | Inventory, contract file, CI lint added on the old agent | Lint passes; inventory owners assigned |
| Week 1 | Canary one non-critical consumer with dual-emit and Collector shim | Span diff has zero unexplained entries |
| Week 2 | Widen canary to one critical service during peak | Alerts, SLO values and lag match baseline |
| Weeks 3 to 4 | Roll out service by service, migrate dashboards to new names | compat.remapped count trending to zero |
| Week 5 | Remove shim and dual-emit; update contract | CI lint passes on new names only |
The upgrade itself is one row's worth of work. Everything else is the scaffolding around it.
Spring Boot 4 specifics worth checking
Spring Boot 4 ships Micrometer-based observability of its own. If you run both the Java agent and Spring's native instrumentation, confirm which one produces the Kafka spans, because duplicates or clashing names after an upgrade are common. Pick one owner per library and disable the other. If a framework upgrade also moved your HTTP clients, the notes in my RestClient migration guide apply: outbound span names can shift when the client does.
Also check resource attributes such as service.name and k8s.* metadata. They are outside the Kafka rename, but bumping the agent and the Collector together can alter them, and every dashboard variable depends on them.
What I would tell a team lead
The playbook costs roughly a week of part-time work for one engineer. Discovering mid-incident that an alert has been blind since the upgrade costs customer trust and, in regulated finance, audit findings. Under DORA and NIS2 a monitoring gap is something an assessor will ask about, which is why I file the contract file under compliance evidence as code for Spring Boot and Kubernetes. I would spend the week every time. More of the systems I have run are on my experience page, and the projects section shows the live market-data work where observability choices get tested daily.
The short version
- Inventory every query, alert, SLO and sampling rule that depends on span names or attributes.
- Prefer dual-emit or the documented stability opt-in so old and new telemetry coexist.
- Use the Collector transform processor to remap new names to old while consumers migrate.
- Canary one cohort, diff span shapes and compare behaviour under peak load.
- Lint alert queries against a telemetry contract in CI, and treat "no data" as a failure state.
Do the first one today: run the Step 1 grep against your dashboards and alerts repository, open the output file, and assign an owner to every line before anyone bumps the agent version. If you want a second pair of hands designing the canary for your own fleet, reach me through the contact section.
FAQ
Will OpenTelemetry Java agent 3.0 break my Kafka dashboards?
It can. Kafka spans move to verb-style names such as poll orders and process orders, so any panel, alert or SLO filtering on the old names may return no data. Check the 3.0 release notes for your instrumentation versions and run the inventory before upgrading.
How do I keep old span names while migrating?
Use the documented stability opt-in to emit both shapes if it covers messaging, and add a Collector transform processor that remaps new names back to old ones. Remove the shim once every dashboard and alert uses the new names.
How do I test an agent upgrade in Kubernetes?
Canary one pod of a consumer group on the new agent, tag its telemetry with a rollout attribute, export spans from both cohorts and diff the span shapes. Run it through a peak period before widening.
How do I stop alerts from silently going blind?
Keep a telemetry contract file, lint every alert query against it in CI, and set critical alerts to fire on missing data instead of treating absence as healthy.